Finding Thermistor Beta Values
When you are faced with an unknown thermistor it is a relatively simple exercise to figure out an expression that will work for it - for NTC (Negative Temperature Coefficient) Thermistors at least. The expression relating temperature to resistance is:
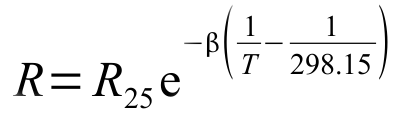
Firstly the resistance at 25°C is relatively simple by dipping the thermistor in water at about 25°C and seeing what the resistance is. It should be a common resistance value such as 100Ω, 500Ω, 1kΩ, 4.7kΩ, 10kΩ, 47kΩ, or 100kΩ. This will give you the R25 value for the Thermistor expression.
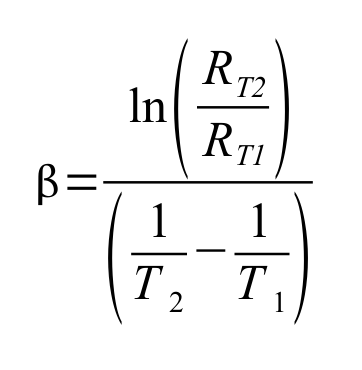
The Beta value can be found if you have two temperatures and their corresponding resistances. Ideally the Beta value is defined by the resistances at 25°C and 85°C.
In the case of the Solar Water Heater Controller project I measured the resistance of the unknown thermistors at a number of temperatures and read the temperature from the device attached to the thermistors because I had not way of measuring the actual temperature where the thermistors were located. Ideally I would have had a known temperature to work with in the form of a bowl of water and a thermometer.
Here is a selection of the results.
| Resistance (kΩ) | Temperature (°C) | Temperature (K) |
| 12.44 | 19 | 292 |
| 9.43 | 27 | 300 |
| 7.9 | 31 | 304 |
| 5.2 | 43 | 316 |
| 4.8 | 45 | 318 |
| 2.7 | 63 | 336 |
| 2.4 | 67 | 340 |
| 2.2 | 70 | 343 |
| 2.1 | 73 | 346 |
By calculating the Beta value for each pair of readings then doing it several more times with different pairs of readings I was able to come up with a number of Beta values. These I averaged to get a Beta value of 3410K for these particular thermistors.
As a check I put the new Beta Value into the thermistor expression and saw that the calculated resistance value was a pretty good match to the results. The plot below has a scatter of the readings and a curve created using the calculated Beta value.
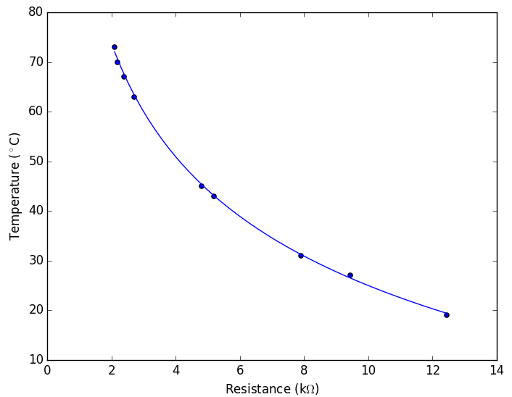
Incidentally, the plot above was created using Python and Matplotlib. The script for generating this plot is;
import matplotlib.pyplot as plt
import numpy as np

fig, ax = plt.subplots()

ResistanceX = np.array([12.44,9.43,7.9,5.2,4.8,2.7,2.4,2.2,2.1])
TempReadingY = np.array([19,27,31,43,45,63,67,70,73])

ThermBeta = 3410

ResistanceX2 = np.linspace(2.1,12.44,50)
TempCalc = 1/(1/298+1/ThermBeta*np.log(ResistanceX2/10))-273

ax.plot(ResistanceX2,TempCalc)

ax.scatter(ResistanceX,TempReadingY)

ax.set_xlabel(r"Resistance (k$\Omega$)")
ax.set_ylabel(r"Temperature ($^\circ$C)")

plt.show()